Every business hits a point where things get messy. Reporting lines blur. Tasks fall through the cracks. People start wondering: who does what, and who reports to whom? That’s where the org chart comes in. It’s not a vanity graphic. It’s an operational necessity.
At Penbrothers, we’ve seen firsthand how fast-growing companies—especially startups and SMEs—struggle with organizational clarity. Whether you’re running a 10-person remote team or scaling a 150-headcount company across time zones, an org chart isn’t optional. It’s the blueprint that holds your structure together.
What Is an Org Chart?
An org chart (short for organizational chart) is a visual map of your company’s structure. It outlines how departments relate, who reports to whom, and where every team member fits into the big picture. Think of it as Google Maps for your company hierarchy.
It answers three critical questions:
- Who is responsible for what?
- Who reports to whom?
- How do departments and roles connect?
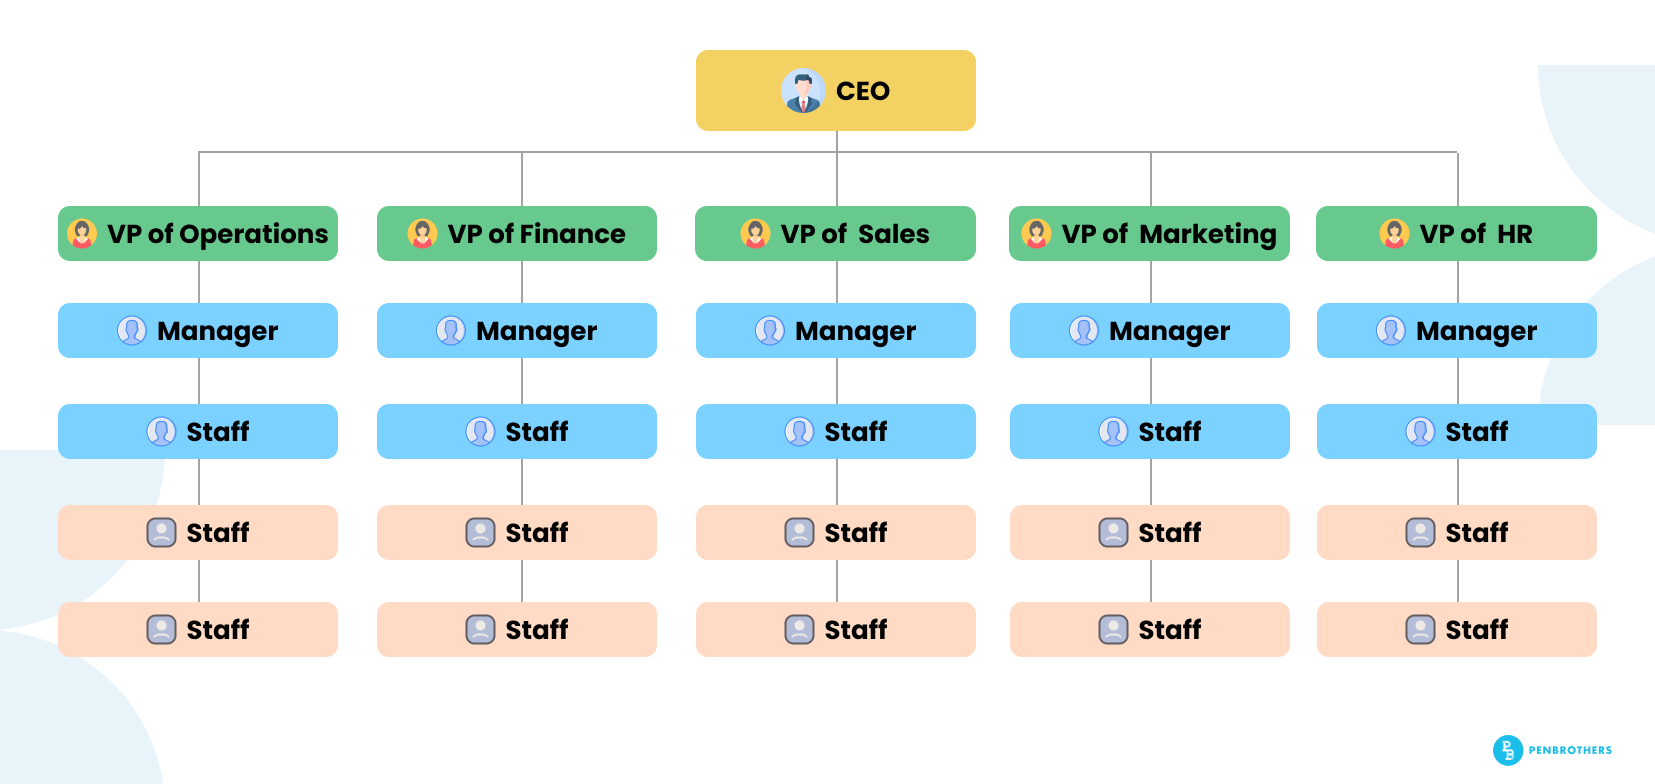
Here’s a simplified sample showing roles, reporting lines, and structure in a typical growing company.
In remote and offshore setups—like those common in the Philippines—the org chart becomes even more essential. Without watercooler conversations or office walkthroughs, employees need a reliable way to orient themselves.
According to Gallup’s employee engagement data, only 23% of employees are truly engaged in their work, underscoring the need for clear structures like org charts to enhance efficiency and clarity.
Why Is an Org Chart Crucial for Your Business?
A well-designed org chart isn’t just pretty—it’s powerful. It’s the scaffolding of your organization. It sets expectations, clarifies accountability, and helps teams work together with purpose instead of friction.
Here’s what an effective org chart unlocks:
- Better Communication: When everyone knows who they report to and who reports to them, communication becomes faster and more purposeful. Employees don’t waste time looping in the wrong people or sitting on decisions because they’re unsure who owns them. For distributed and hybrid teams, this clarity is critical. It reduces ambiguity in day-to-day operations and ensures vital updates reach the right people at the right time.
- Role Clarity: Org charts clearly define what each role is responsible for—removing gray areas and minimizing task duplication. When roles are mapped out visually, overlaps and gaps become obvious and actionable. This clarity prevents employees from stepping on each other’s toes or letting essential duties fall through the cracks.
- Faster Decision-Making: With a clear hierarchy and ownership, decisions are routed to the right stakeholders without delay. McKinsey’s research does highlight the importance of clear decision-making structures in enhancing organizational efficiency. For instance, their article “Decision making in the age of urgency” discusses how organizations that excel in decision-making practices tend to make high-quality decisions quickly and execute them effectively, leading to better financial outcomes. That speed can be a major competitive advantage—especially for startups and growing businesses.
- Stronger Onboarding: For new hires—especially remote ones—joining a company can feel like walking into a maze. An org chart provides them with a map. It shows where they fit in, who they’ll work with, and who their go-to people are. This accelerates onboarding, boosts confidence, and improves early engagement.
- Cross-Functional Collaboration: As companies grow, silos naturally emerge. An org chart reveals how departments connect—or where they should. It makes it easier to form cross-functional teams and run collaborative projects, because everyone can visualize the relationships and reporting lines that shape how work flows across functions.
- Scalability: Without structure, growth becomes chaotic. A thoughtfully designed org chart helps businesses scale by creating order. It’s easier to spot where to add new roles, delegate authority, or restructure departments when your organizational map is visible and dynamic. It also ensures that as headcount grows, so does accountability.
In the BPO and offshore staffing industry, where distributed teams are the norm, org charts reduce friction between the client’s HQ and their offshore teams. They enable alignment and accountability. Explore how Penbrothers’ offshoring strategy helps teams thrive.
Different Types of Org Charts
Choosing the right org chart depends on your company’s structure. Here are the most common types:
- Hierarchical
The classic model. One boss at the top, clear lines of authority. Best for companies that value control and predictability. - Divisional
Teams are grouped by product line, region, or service. Ideal for multi-location companies or those managing several brands. - Matrix
Employees report to two or more managers (e.g., a project lead and a department head). Common in tech and consulting industries but requires strong communication. - Flat
Fewer layers. More autonomy. Favoured by startups and creative agencies. Works well with experienced teams who value speed over structure. - Hybrid or Flatarchy
A mix of the above. Encourages agility but needs clarity to avoid confusion.
At Penbrothers, many of our clients adopt hybrid or matrix models. These structures allow them to retain control while maximizing cross-border collaboration.
How to Create an Org Chart (Step-by-Step)
Building an org chart sounds daunting—but it’s not. Here’s a straightforward process you can follow:
- List All Roles and Responsibilities
Start with a comprehensive role inventory. Include every position in your organization—from the CEO and founders down to team-level roles and support staff.
Don’t just stop at titles. Clearly define what each role is responsible for. This isn’t just for visuals; it helps identify redundancy, missing roles, or unclear scopes that might be causing internal friction. For example, if two people are unofficially sharing a function (like “marketing strategy”), now’s the time to make that visible—and fix it.
Tip: If you’re in a hybrid or offshore setup, make sure you distinguish between client-side and offshore-side responsibilities.
- Map Out the Hierarchy
Decide what structure best reflects your company. Are you centralized, decentralized, project-based, or cross-functional? Choose from among the four common structures highlighted by Remote.com:
- Functional – Organized by expertise (e.g., marketing, finance, tech). Best for efficiency but may silo teams. This structure promotes deep specialization and streamlined processes within each function. It works especially well for companies focused on operational excellence and cost control. However, it can limit cross-departmental communication and slow responsiveness to market changes if collaboration isn’t actively facilitated.
- Divisional – Based on products, regions, or services. Ideal for companies managing multiple brands or markets. Each division operates almost like a mini-company with its own resources, goals, and leadership. This allows for quicker decision-making within each unit and better alignment with customer needs in different markets. On the downside, it can lead to resource duplication and inconsistent standards across divisions.
- Matrix – Employees report to both functional and project leaders. Great for collaboration but adds complexity. This structure fosters cross-functional communication and ensures that both functional expertise and project goals are prioritized. It’s common in multinational corporations and project-driven organizations. However, the dual-reporting nature can lead to confusion, conflicting priorities, and power struggles without strong coordination.
- Flatarchy – Few layers, high agility. Works well for startups and creative teams but needs clear ownership to avoid chaos. This hybrid model encourages innovation and rapid decision-making by reducing bureaucracy. Employees are empowered to act and collaborate directly with leadership. Still, without defined accountability, roles can blur, leading to inefficiencies or decision bottlenecks as the company scal
Whatever model you use, clarity is key. Ensure everyone knows their direct and dotted-line relationships.
- Draw Relationships and Reporting Lines
Here’s where it becomes real. Use visual tools like Lucidchart, OrgWeaver, or Miro to lay out your structure. Start from the top and draw lines down to show who reports to whom, and laterally to show cross-functional coordination if applicable.
Keep it clean. Avoid cramming in too much detail. The org chart should be readable at a glance—not a maze of names and arrows. For dual-reporting structures (e.g., matrix setups), use dotted lines or color codes to distinguish responsibilities.
- Account for Dual Roles or Cross-Functions
In modern organizations, especially startups and remote-first companies, it’s common for one person to wear multiple hats. A project manager might also lead internal operations. A designer may report to both marketing and product.
Represent these accurately to avoid underestimating workloads or confusing reporting lines. Transparency here isn’t just about accountability—it builds trust.
- Make It Accessible
An org chart isn’t helpful if no one can find it. Publish it in your company’s HRIS, shared drive, or internal wiki. Make sure it’s easy to access—especially for new hires or distributed team members who don’t have the luxury of in-person context.
Better yet, include the org chart as part of your onboarding documentation. It’s one of the most effective orientation tools you can offer.
- Review Quarterly
Org charts aren’t static. Businesses evolve—new departments emerge, reporting lines shift, and roles get consolidated. An outdated org chart is more dangerous than none at all because it creates a false sense of clarity.
Review your org chart at least once a quarter or whenever a significant organizational change occurs (e.g., a re-org, merger, or product pivot).
Pro tip: If you’re scaling offshore teams, involve both local and foreign managers in this process. It builds buy-in and ensures context isn’t lost in translation.
Common Mistakes to Avoid
Even good intentions can go wrong. Watch out for these common org chart pitfalls:
- Neglecting Updates
Fast-moving teams change. Your org chart should reflect that. Outdated charts create confusion during onboarding, project assignments, and performance reviews. Set a recurring cadence—quarterly or bi-annually—to review and revise the chart. - Overcomplicating It
Keep it digestible. Don’t try to show every internal relationship. Over-engineered org charts overwhelm more than they inform. Focus on showing reporting lines and key functions, not every informal interaction or ad hoc task force. - Forgetting Cross-Functional Roles
In today’s agile setups, many employees span multiple teams. Make them visible. Ignoring these hybrid roles can lead to underutilization, duplicated efforts, or reporting confusion—especially in remote or project-based environments. - Not Aligning with Reality
If your chart doesn’t reflect how work actually flows, it loses credibility. Leadership may appear cleanly structured on paper, but if decisions and responsibilities follow a different path in practice, the org chart can create false expectations and lead to inefficiencies. Our blog on hybrid work explains how structure and reality must sync, especially in distributed setups. - Creating It in Isolation
Don’t let HR do it alone. Involve team leads and executives. Org design is a strategic function, not just an administrative task. Collaborative input ensures the chart reflects business priorities and operational realities—not just headcounts.
HBR has emphasized the importance of aligning organizational design with strategy and embracing agility.
For instance, in the article “Design Your Organization to Match Your Strategy”, the authors highlight that, “Only 10% of organizations are successful at aligning their strategy with their organization design.” This underscores the necessity for organizations to adapt their structures in tandem with evolving strategies, especially in agile and cross-functional contexts.
At Penbrothers, we help our clients translate their org design into functional team structures. That means we’re not just filling roles—we’re co-architecting how work gets done.
Final Thoughts
The org chart isn’t just a nice-to-have. It’s a business tool that drives performance, clarity, and cohesion. For growing companies—especially those operating across borders—it becomes a single source of truth.
At Penbrothers, we don’t just provide offshore talent. We help you structure your team for scale. Whether you’re setting up your first remote team or rethinking your entire workforce model, we’re here to help you bring order to complexity.
Need help structuring your offshore team the right way? Let’s talk. Get in touch with us.
Start with your org chart. Everything else follows from there.